Data Visualization for Healthcare Quality Improvement
by Health Design Lab
← Back to Showcase
Graduation year: 2015
Healthcare authorities deal with vast amounts of data. Some of this is used to identify the overall health of patients, while other information indicates how well the hospital personnel are following evidence-based clinical practices. In all cases, the data needs to be captured and communicated to the healthcare personnel in a fast and easy-to-interpret way so they can act upon it and provide the best care possible. Vancouver Coastal Health (VCH) asked the Health Design Lab to consider this visualization challenge.
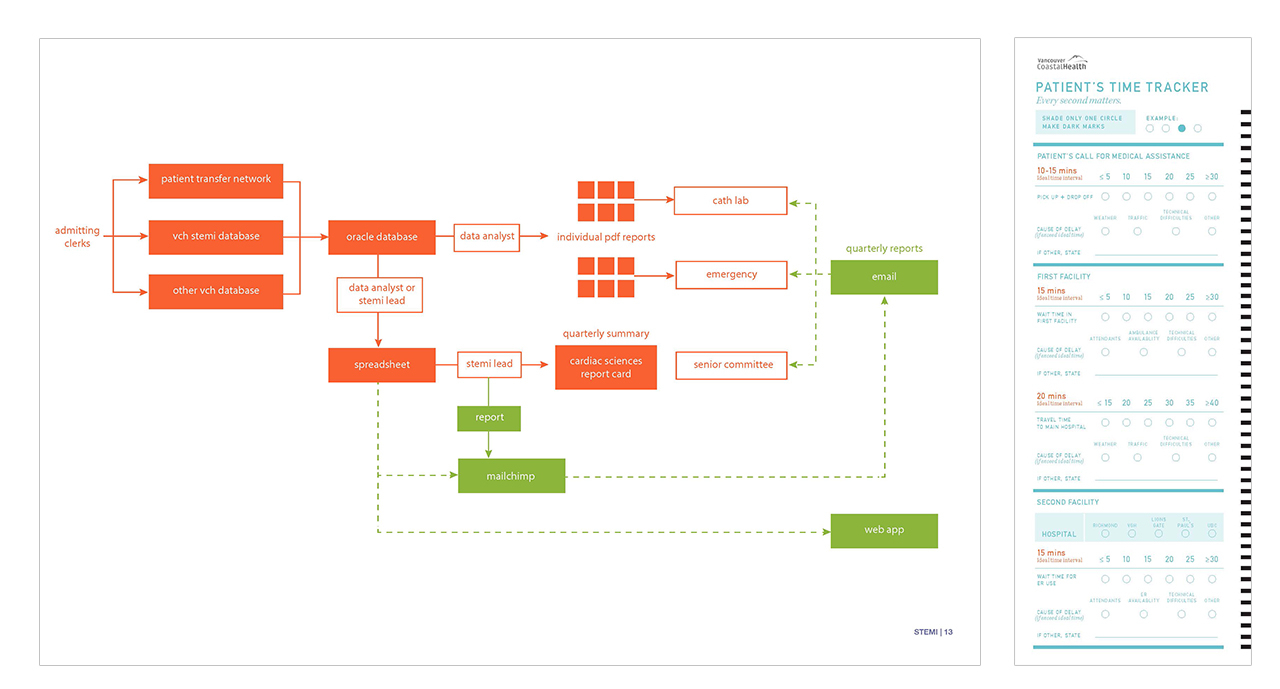
Emily Carr researchers engaged in a close collaboration with VCH staff and personnel to understand how data was collected and displayed. Specifically, student researchers were asked to represent data and order sets for heart failure patients. The resulting design work aims to reduce the cognitive load it takes to understand complicated data sets for heart failure patients. The big picture was kept in mind to determine how solutions could fit into the current ecosystem of software and workflows. Researchers considered the display of information but also explored ways that data could be captured and input into medical records. These data visualizations considered both low and high technology solutions. Currently, phase 2 of the project is under way, which considers how these visualizations may be implemented into the complex real-world environment of VCH.
Some examples from the project: 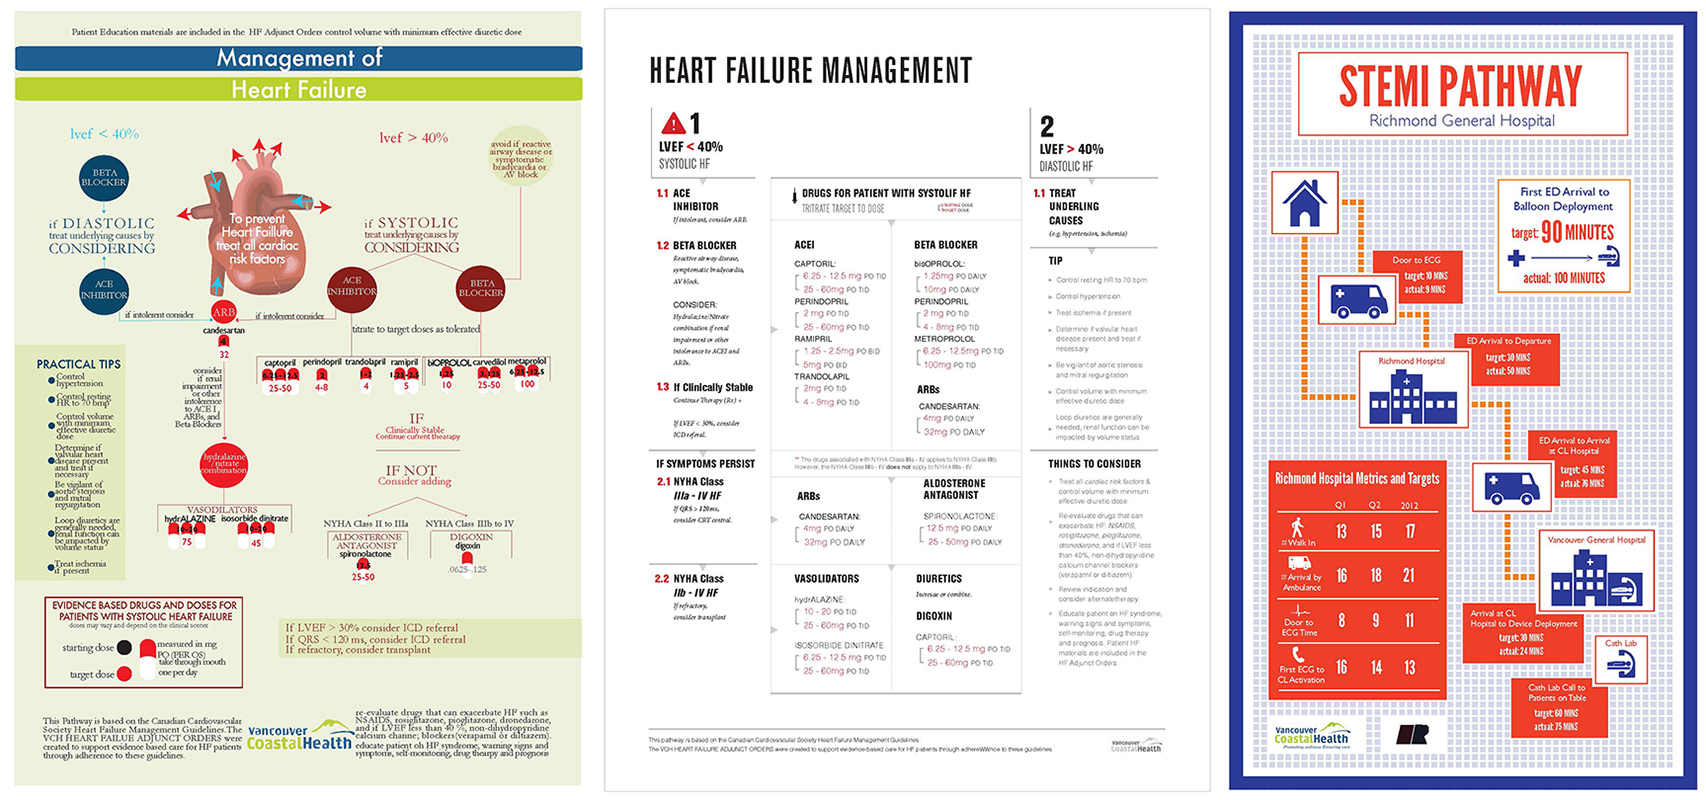

About the Artist
Emily Carr Students are eligible to submit their work for consideration in the Showcase.
Make a Submission